
So would you like to make Dyno power runs…just using a Datalogger? If yes, then keep reading.
Just a note…there’s a small introduction about the whole process in the beginning but if you’re in a hurry, feel free to jump ahead.
Datalogging is a cornerstone of ECU tuning.. Without data, everything is reduced to guesswork, calculated estimations, or ‘Hail Marys’.
There are different types of dataloggers…from OBD2 adapters and Torque Pro App combos to expensive Autel PID Loggers. The most effective type of loggers when tuning vehicles however, are Memory Loggers. These type of logging tool and software is able to read the data straight into the ECU, as the ECU is seeing it. Our Penta Performance Logger is a memory logger. Unlike OBD2 loggers, which are great for simple diagnostics but often fall short for tuning purposes, memory loggers like the Penta Performance Datalogger read data directly from the ECU, just as the ECU sees it. This makes it an invaluable tool for tuning, as it provides the precise data necessary for comprehensive analysis.
However, to truly optimize your vehicle’s performance, you’ll need more than just a top-tier datalogger. You’ll need a way to understand the data you’re collecting. This is where Virtual Dyno comes in.
Virtual Dyno
Virtual Dyno is the brainchild of Brad Barnhill. Using the power of mathematics, he created a program that loads your vehicle logs, performs all the necessary calculations, and outputs a dyno graph based on the inputted log data. He factors in everything from the tire diameter and vehicle weight to the drag coefficient, allowing you to obtain accurate and repeatable results.This software is so accurate that it has been a secret weapon for tuners for years. Of course, the saying goes, “you’re only as accurate as your tools,” but remember, if you’re reading this, it means you already have, or are planning to get, the Penta Performance Logger, so we’ve got accuracy covered.
And the best part about this software? It is FREE! That’s right, it is donation-based. We highly suggest buying Brad a cup of coffee when you’re able to. Okay, now with that intro out of the way, let’s proceed to the steps on how to produce the graph.
Install and Setup Virtual Dyno
First step is to download Virtual Dyno. It is hosted at https://barnhill.bitbucket.io/ but if the site is down, we have a mirror of it at the end of this article.
After installing it, you need to configure the parameters. Go to File, Car Editor. Unfortunately, he didn’t have our C30 listed under Volvo so you need to go Custom> then create one for your vehicle. Most of the information you can get online. If you have a pre-facelift C30 M66? Then you’re in luck because we happen to have one posted on a photo below.
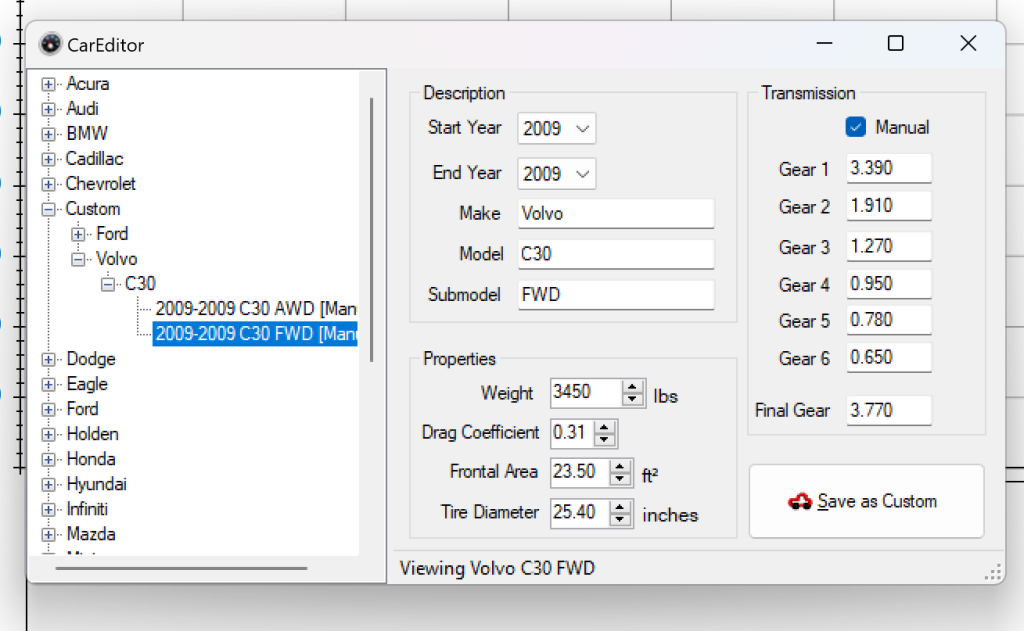
The important thing here is to get the Gear ratio right as it will determine the calculation. The tyre size also has a large factor so get that right too (ours is not the same as the standard tyre diameter).
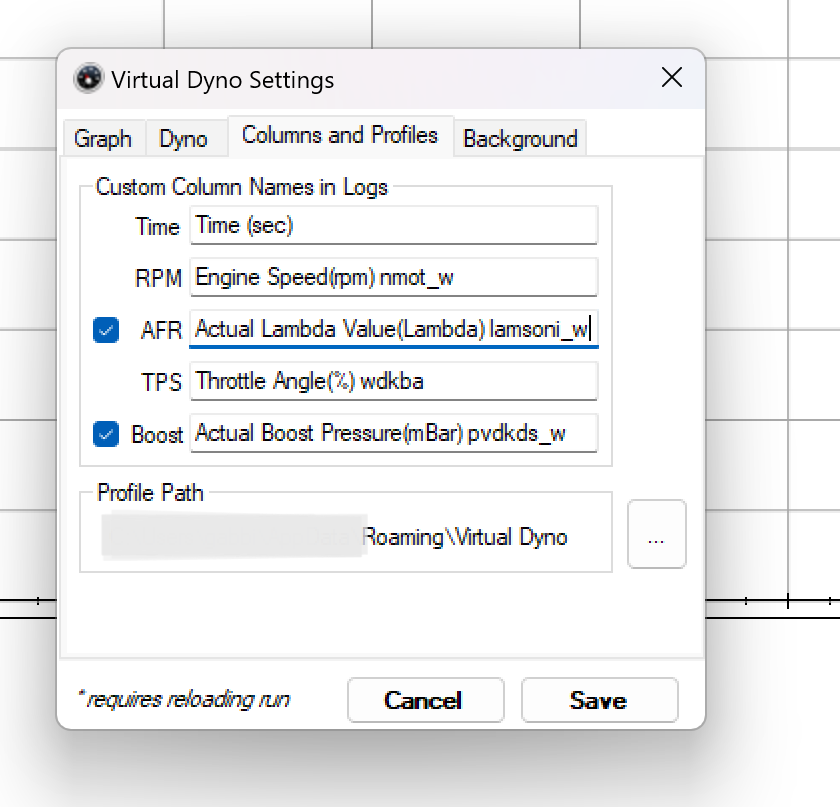
After that, you need to set the Options. There are 4 tabs in the Options section which allows you to set your preferences. The important bit though are the CSV headers. Remember, Your Penta Logger outputs a CSV file. You need to copy those headers exactly as it is. Go to your Columns and Profiles Tab. You will need values for Time, RPM, AFR, Throttle Position (TPS) and Boost. If you haven’t made a datalog CSV yet, skip this. You can always go back to this in the future
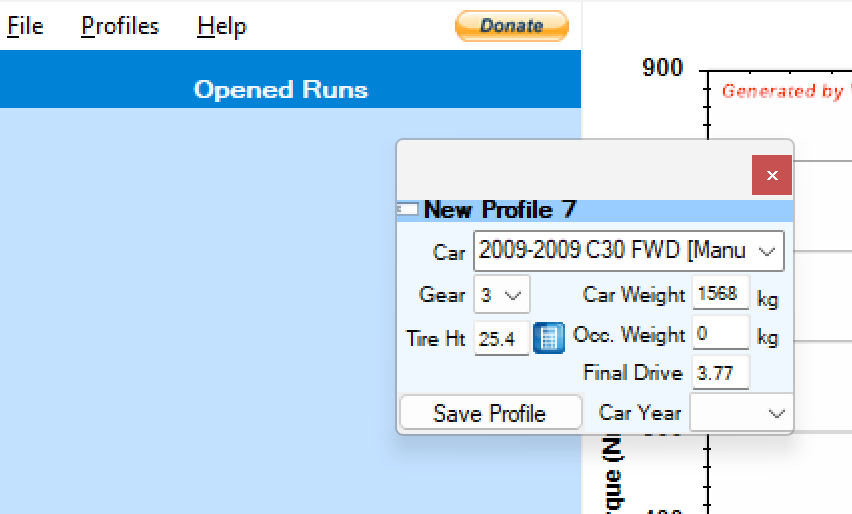
Lastly, you need to set the Profile. Click add Profile and this little window pops up. This sets the profile of the datalogs. Say for example you did a power run on 4th gear, if this is set to 3rd, you would read lower HP. Make sure you make this as true as possible.
Once you have done this, you’re good to go. Time for some power runs!
Doing Power Runs
Power runs are basically full wide-open-throttle runs from just below 2000RPMS all the way up to Redline 6,500RPM – WITHOUT changing gears. If you’ve seen how a dyno power run is done, this is somewhat the same. With regards to datalogging, the higher the gear, the more accurate the data. Problem is, doing a power run in 4th will be somewhere around 200 kph at Redline so it is not for the faint of heart. We suggest doing it in 3rd gear on a flat strip of road, like a private runway or a dragstrip…but an uphill area on 2nd gear shows the same promise. Either way you choose, just make sure it adheres to the following guidelines below.
- Consistently use the same strip of road – The main purpose of creating dyno graphs is to make them comparable to each other. If your data is not consistent, creating them is moot. For this, you want to make your variables as constant as possible. That means, using the same strip of pavement every time, on the same direction. If you do this, your power runs will be within 5whp, which in my opinion, is better than most dynamometers.
- Be consistent with your weight – It’s always fun to take passengers during power runs. Unfortunately, an extra 100kg WILL throw off your runs, making them less accurate.
- Avoid Wheel Slip / Spin – When doing road tuning, any runs with wheel slip, we consider as a failed run. Wheel spin would show as a spike increase in torque. Wheel slip is when your DSTC detects uneven rotation between both wheels and cuts throttle or even apply brakes to correct itself. This is usually indicated by the yellow DSTC light turning on.
Datalogging Process
- While the vehicle is stopped, connect the J2534 cable to the OBD port and the other side to a laptop. Once you have put in the necessary settings for the logger and the START LOGGING button is on, you can either start the logging process now or if you prefer, start it 5 seconds before your power run. Make sure the laptop is in a secure place.
- Get the vehicle moving until it’s maintaining (not accelerating to) around 35-40kph in 3rd gear, just under 2000RPM. I usually target 1,750 RPM. Adjust this speed if you are on a different gear.
- Once you are ready, floor the accelerator to WOT (wide-open throttle) until you reach redline or past 6k RPM. FOR AUTO TRANSMISSION: The auto transmission has a kick down feature which drops you a gear or two, EVEN when you’re in Geartronic mode. It gets a bit tricky as this is exactly what you want to avoid. The trick here is to gradually step on the accelerator. In detail, let’s say you start at 1,750RPM, you gradually modulate the accelerator so you end up WOT at 3000RPM. This has a slight learning curve and I suggest you practice prior to doing an actual run.
- Right after the power run, avoid stomping on the brakes. Watch out for lift-off oversteer. If you feel a slight oversteer, accelerate the car a bit then slow to a stop again. Stopping the car quickly will cause all the weight to shift forward, making the rear tyres loose traction. Use the engine braking of the vehicle and slowly roll to a stop.
That’s it, power run is done. You can either do a second one just to make sure you have enough data…or just for the fun of it. Just don’t forget to stop the logger after each run.
Data Processing and Loading of the Logs
Now we do a bit of data processing so that our logs can be loaded to Virtual Dyno.
- First step is to open the CSV to double check the data. You can use any CSV viewer. We just use Microsft Excel but any will do.
- Next, you need to find the instance of the your power run. The way to tell that is to check the throttle angle log for a prolonged max value (usually around 100). Once you’ve found the rows that handle them, you can delete the other rows outside of it. This step is actually optional as Virtual Dyno usually sorts through it, but sometimes it can throw it off so it’s good practice to do so.
- The boost being recorded on the datalogger is the absolute boost (includes barometric pressure). If you want it to show just the gains, find out the current barometric pressure and deduct it. If I’m being lazy, I just deduct 1000 and call it a day. After that, you can proceed and load your log to Virtual Dyno.
- Click File, Load Logs…and wait for the Magic.
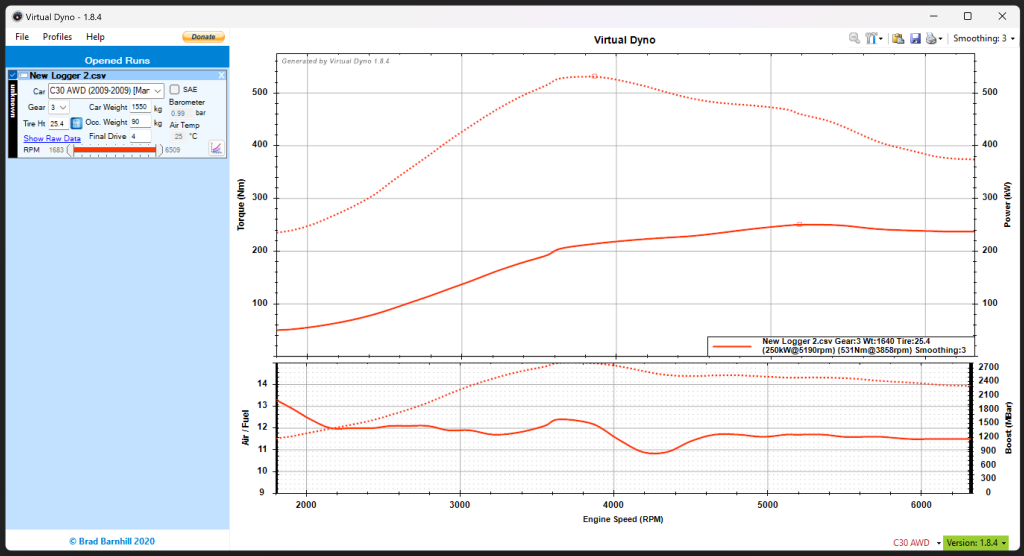
- That’s it! You have now loaded your logs. If the logs are too erratic, don’t panic. Just play around with the smoothing on the top right corner. We personally have ours set to 3 permanently.
Now its very fun to see your very own Dyno graph and if the parameters you put in are correct, then its actually quite accurate and within 1-3% of a true dyno reading. However, that should be taken with a grain of salt as not even dyno readings from different dynamometers can be compared due to the reading difference. However, the best part of Virtual Dyno is comparing your OWN runs, like the one below. For example, you want to see if a pod intake has power gains? Easy. Do 2 runs before installing it and do 2 runs after. With that, you can compare your logs to see if there are gains present.
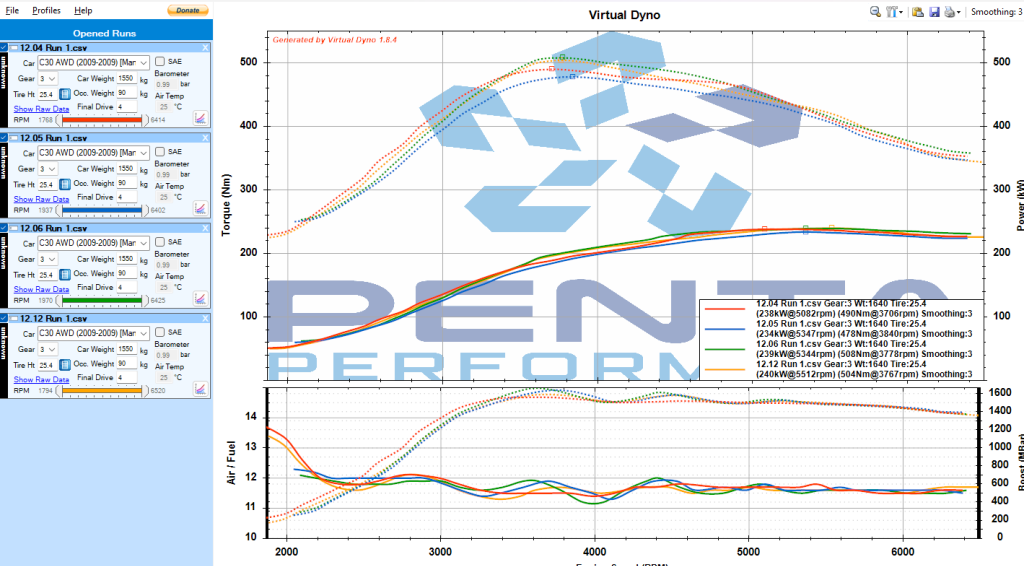
To put it into context, the VDyno graphs above were when we were tuning the wastegate map of our turbo. It was showing good numbers but we were getting boost spikes so we reworked the boost and fueling until it ran well. As you can see, our first attempt to fix the issue actually resulted in a loss of power. If a tuner didn’t have the logging tools, they would’ve left it at that.